Hatchet

- Role
- Product Designer
- Team
- Freelance, with Productea
- Platforms
- Web
- Outcome
- Data-heavy dashboards
Analytics dashboards and data-heavy interfaces for Hatchet, formerly StreamHatchet, a streaming intelligence platform. Work through Productea, 2024 to now.
Dense, but readable
Streaming data is wide and deep: platforms, creators, games, hours watched, peak viewers. The job is making it readable at a glance, without hiding the depth analysts come for.
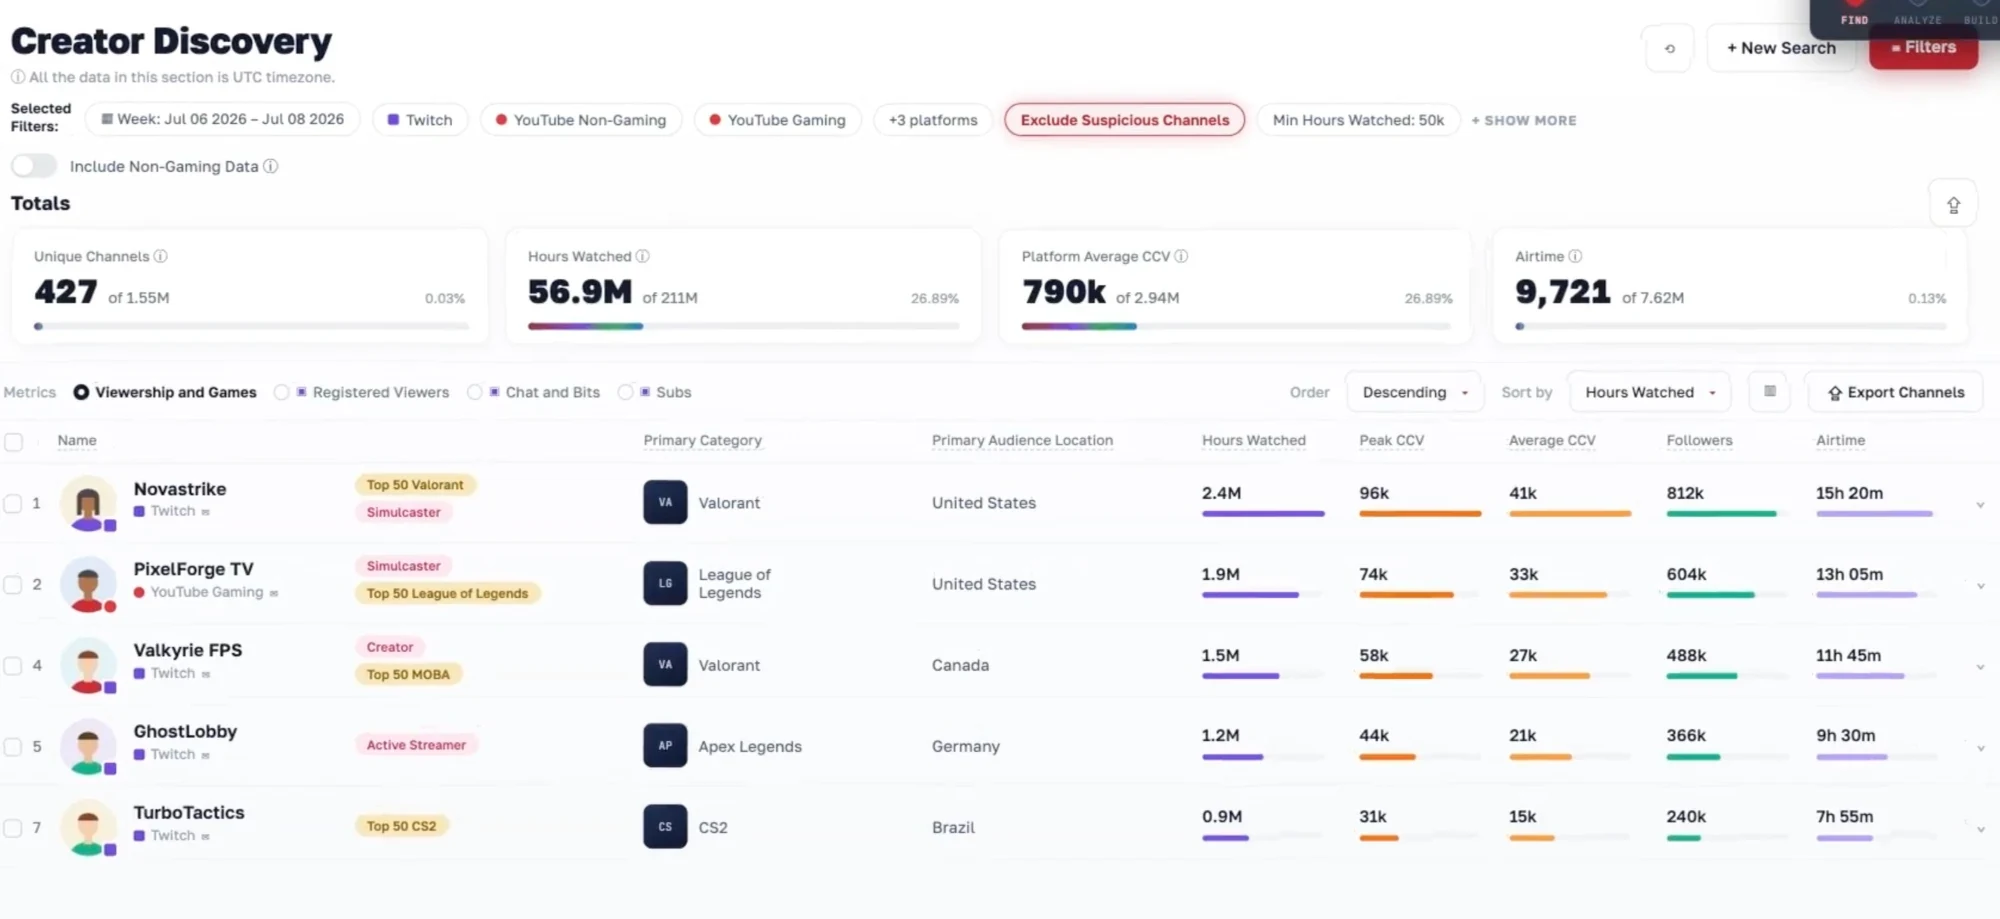
Creator Discovery reads top to bottom: totals first, then quick lenses like trending or fast growing, then a sortable table of creators.
Filters that stay open
Platforms, period, genres and VTuber channels sit in a panel that stays open beside the results, with Apply, Clear and Share at its foot. A search can be tuned and passed to a colleague without leaving the page.
Whatever is applied shows as a row of chips above the results, so the numbers below always say what they are counting. Totals carry a bar for their share of the whole platform, and every column in the creator table gets one too, so the ranking reads before the figures do.
Campaigns, in plain language
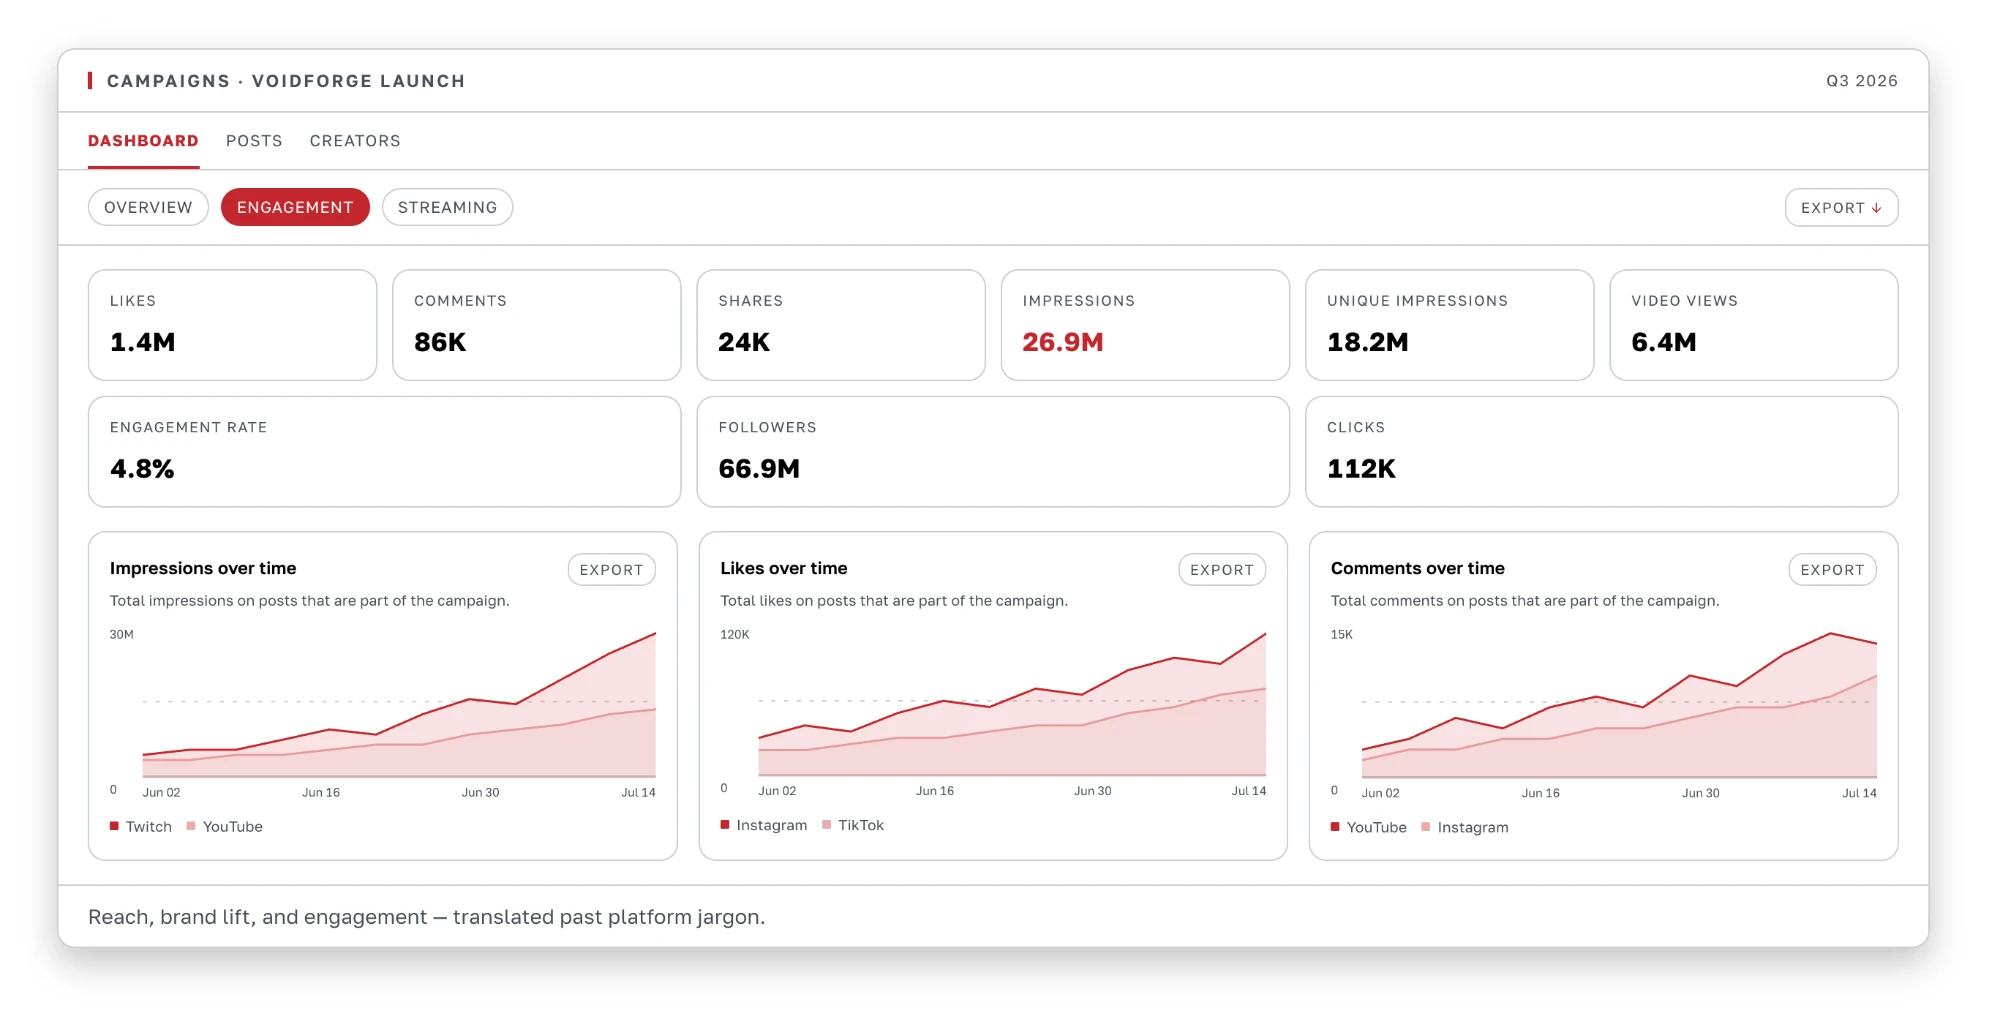
Brands entering gaming run campaigns across Twitch, YouTube, TikTok and Instagram, then have to explain the results to people who do not speak Twitch.
The campaign dashboard answers that in one view. Dashboard, Posts and Creators tabs sit on top, with Overview, Engagement and Streaming lenses below them. Nine headline numbers come first, impressions picked out in red. Each chart underneath compares platforms over time and exports on its own.